18 Results
Articles
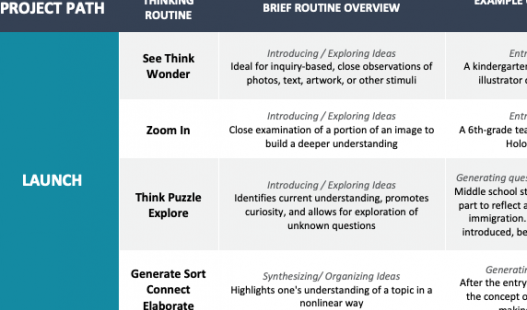
This table shows some examples of how teachers used thinking routines in PBL units.

Product Toolkit
Event planning and hosting involve designing, organizing, and holding a gathering or activity for a specific audience and purpose. Events can range from small, focused workshops to larger-scale exhibitions, performances, or community celebrations.

Product Toolkit
A social media campaign is a coordinated effort to use social media platforms to promote a message, product, or cause. These campaigns involve creating content such as posts, videos, and graphics designed to engage and inform an online audience.

Product Toolkit
A public service announcement (PSA) is a short, impactful message created to raise awareness or influence attitudes and behavior about a specific issue. PSAs often use visual and auditory storytelling to engage the audience and deliver a clear, memorable message.

Product Toolkit
A policy proposal is a formal document or presentation that outlines a recommended course of action to address a specific problem or need. It typically includes an issue analysis, proposed solutions, evidence supporting the recommendations, and an implementation plan.

Product Toolkit
A physical model or prototype is a tangible representation of an idea, object, or system. Models are used to visualize concepts, simulate processes, or communicate design ideas while prototypes serve as functional examples for testing and iteration

Product Toolkit
An idea talk (inclusive of TED Talks, PechaKuchas, Ignite Talks, and other formats) is a short, concise presentation about a focused idea using a structured format.

Product Toolkit
A podcast is an audio recording or series of audio recordings focused on a particular topic or theme, similar to a talk radio show.

Product Toolkit
An interactive map is a digital map that enables the viewer to explore and engage with the information by panning around, zooming in and out, hovering over points of interest, and clicking on objects to learn more about them. An interactive tour involves placards, QR codes, or other media placed in…
Articles
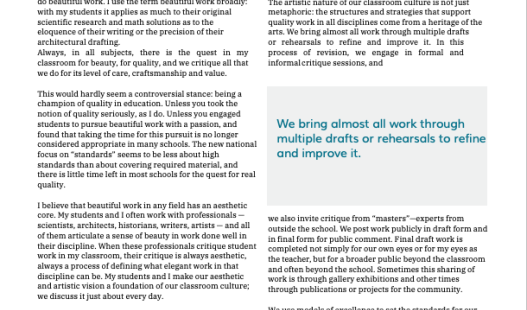
Ron Berger explains how his classroom culture helped students create high-quality products.
Articles
Overview of the why and what of PBLWorks' new model for designing rigorous, engaging projects.

Product Toolkit
A business plan is a document that provides an overview of an existing or new business, outlining its goals as well as the steps and strategies to be implemented in order to achieve those goals. Business plans are developed for both internal purposes and external audiences, such as a plan written…

Product Toolkit
A museum exhibit is a curated collection of artifacts arranged and displayed for viewers' education and/or enjoyment. Exhibits are typically organized around a particular topic or theme with items carefully selected and strategically presented in order to convey a story or message about the subject.

Product Toolkit
A picture book is a book in which the illustrations are as important as – or more important than – the text in telling the story or conveying the message of the book.

Product Toolkit
An infographic is a visual representation of data, information, or ideas using graphics (images, illustrations, charts, diagrams) and minimal text. Infographics are often used to present large data sets or explain complex concepts in a way that is digestible and memorable.
Articles
Overview of BIE's new model for teaching in a Project Based Learning environment.
Articles
A guide to forming teams, helping them become effective, & using peer ratings to adjust grades.
Articles
This article distinguishes between PBL and lightweight "projects" and argues why PBL is essential.