Product Toolkit: Infographic

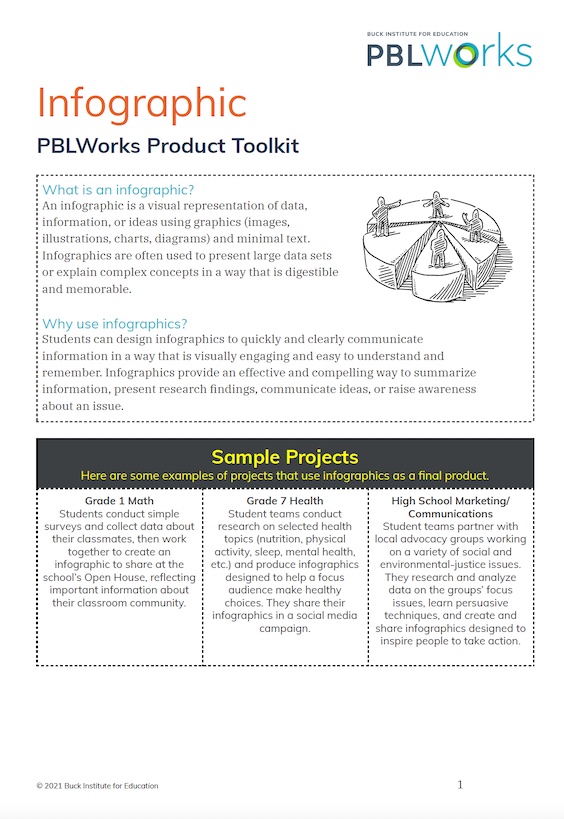
An infographic is a visual representation of data, information, or ideas using graphics (images, illustrations, charts, diagrams) and minimal text. Infographics are often used to present large data sets or explain complex concepts in a way that is digestible and memorable. Download the PDF to learn how to guide your students through the process of making infographics in PBL.
Log in to get this resource...
To view or download this resource, log in here.
LoginDon't have an account yet?Register for free
