67 Results

Product Toolkit
An interactive map is a digital map that enables the viewer to explore and engage with the information by panning around, zooming in and out, hovering over points of interest, and clicking on objects to learn more about them. An interactive tour involves placards, QR codes, or other media placed in…
Articles
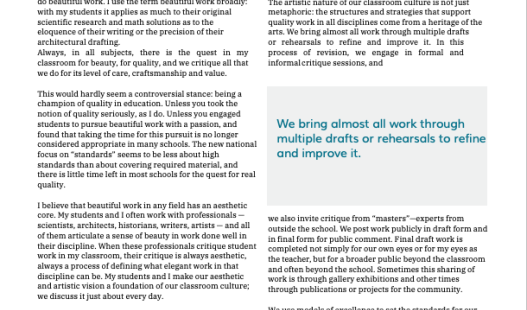
Ron Berger explains how his classroom culture helped students create high-quality products.
Articles
Overview of the why and what of PBLWorks' new model for designing rigorous, engaging projects.
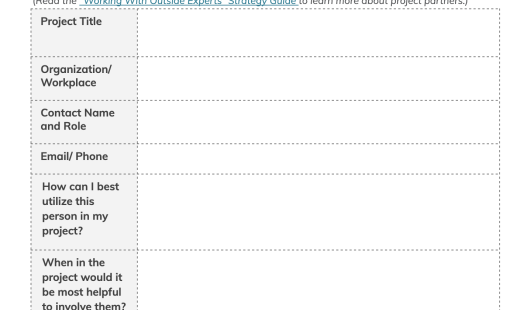
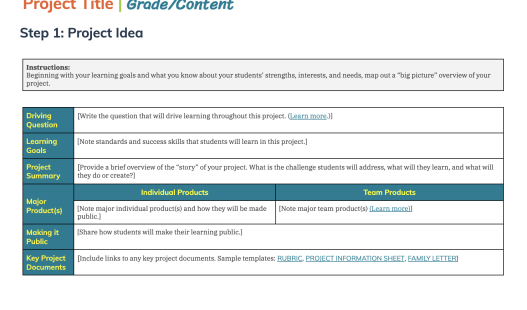
Planning Tools
Use this tool to plan for thoughtful collaboration with industry and community partners.
Project Videos
In this 8th grade ELA project, students in San Gabriel, California work together to develop a quality-controlled fan fiction website for other middle schoolers.
Project Videos
PBLWorks Project Videos 2018: Transitional Kindergarten - Interdisciplinary.

Product Toolkit
A business plan is a document that provides an overview of an existing or new business, outlining its goals as well as the steps and strategies to be implemented in order to achieve those goals. Business plans are developed for both internal purposes and external audiences, such as a plan written…

Product Toolkit
A museum exhibit is a curated collection of artifacts arranged and displayed for viewers' education and/or enjoyment. Exhibits are typically organized around a particular topic or theme with items carefully selected and strategically presented in order to convey a story or message about the subject.

Product Toolkit
A picture book is a book in which the illustrations are as important as – or more important than – the text in telling the story or conveying the message of the book.

Product Toolkit
An infographic is a visual representation of data, information, or ideas using graphics (images, illustrations, charts, diagrams) and minimal text. Infographics are often used to present large data sets or explain complex concepts in a way that is digestible and memorable.
Planning Tools
Frame the DQ's initial words, person or entity, action or challenge, and audience/purpose.
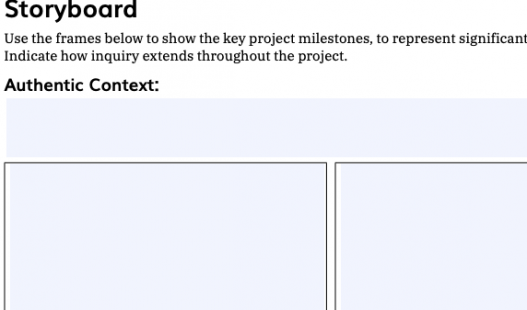
Planning Tools
This planning document is designed to help you list the key project milestones, to represent significant moments or stages.
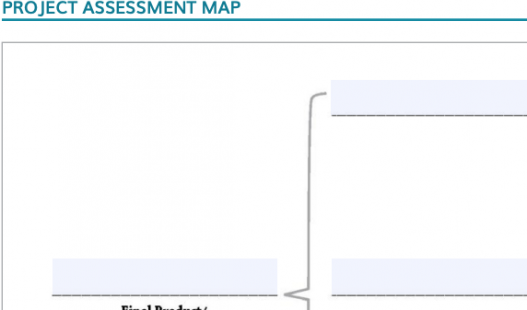
Planning Tools
Plan how to use formative assessment in a project to be sure students are learning content and building 21st century competencies
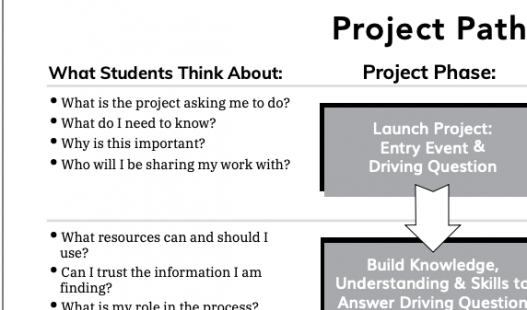
Articles
Overview of BIE's new model for teaching in a Project Based Learning environment.
Articles
A guide to forming teams, helping them become effective, & using peer ratings to adjust grades.
Articles
This article distinguishes between PBL and lightweight "projects" and argues why PBL is essential.

Project Videos
Students present their finished designs to a group of school architects, planners, & designers.

Project Videos
Middle school arts project: animated shorts about the Mexico and U.S. border.