
40 Results
(Document), (Research)
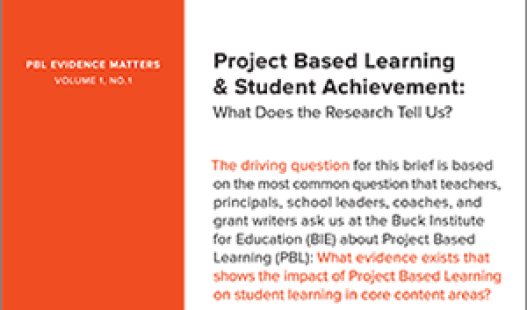
Short 2018 research brief by Buck Institute with evidence of PBL's impact on student learning in cor

(Online Tool)
Create & sustain district-wide PBL initiatives at all levels of the organization.
(Online Tool)
Learn how to bring coherence to PBL practices across grade levels and subject areas.
(Online Tool)
Learn how to design, assess, and manage projects that engage and motivate students.

(Online Tool)
These projects are meant to inspire your own ideas or may be adapted to fit classroom needs.
(Online Tool)
Plan your project online - and digitally share it with others - by summarizing its key pieces.

Articles, (Research)
A useful introduction to PBL including summaries of research studies and PBL in Action.
Articles, (Research)
PBL yields benefits for students, from deeper learning of academic content to increased motivation

(Document), (Research)
A model for an online unit & sample projects
Articles, (Document), (Research)
Out of the Gate: Teacher Education Program-District Partnerships for High-Quality PBL

Articles, (Document), (Research)
BIE hires Dr. Brandon Wiley as new Chief Program Officer
Articles, (Document), (Research)
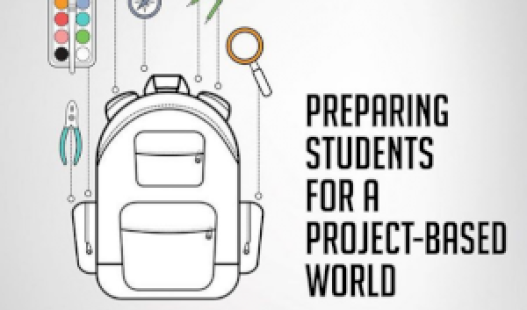
A publication from Getting Smart and BIE

Product Toolkit
A business plan is a document that provides an overview of an existing or new business, outlining its goals as well as the steps and strategies to be implemented in order to achieve those goals. Business plans are developed for both internal purposes and external audiences, such as a plan written…

Product Toolkit
A museum exhibit is a curated collection of artifacts arranged and displayed for viewers' education and/or enjoyment. Exhibits are typically organized around a particular topic or theme with items carefully selected and strategically presented in order to convey a story or message about the subject.

Product Toolkit
An infographic is a visual representation of data, information, or ideas using graphics (images, illustrations, charts, diagrams) and minimal text. Infographics are often used to present large data sets or explain complex concepts in a way that is digestible and memorable.

Product Toolkit
An interactive map is a digital map that enables the viewer to explore and engage with the information by panning around, zooming in and out, hovering over points of interest, and clicking on objects to learn more about them. An interactive tour involves placards, QR codes, or other media placed in…

Product Toolkit
A picture book is a book in which the illustrations are as important as – or more important than – the text in telling the story or conveying the message of the book.
