
27 Results

Student Handouts
May be filled in by project team members to record agreements about how they will work together.
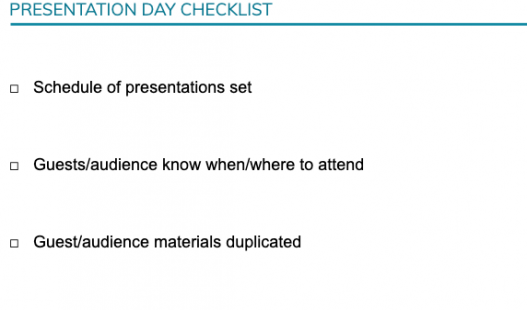
Student Handouts
This checklist helps teachers prepare for project presentations before they start.

Product Toolkit
A business plan is a document that provides an overview of an existing or new business, outlining its goals as well as the steps and strategies to be implemented in order to achieve those goals. Business plans are developed for both internal purposes and external audiences, such as a plan written…

Product Toolkit
A museum exhibit is a curated collection of artifacts arranged and displayed for viewers' education and/or enjoyment. Exhibits are typically organized around a particular topic or theme with items carefully selected and strategically presented in order to convey a story or message about the subject.

Product Toolkit
A picture book is a book in which the illustrations are as important as – or more important than – the text in telling the story or conveying the message of the book.

Product Toolkit
An infographic is a visual representation of data, information, or ideas using graphics (images, illustrations, charts, diagrams) and minimal text. Infographics are often used to present large data sets or explain complex concepts in a way that is digestible and memorable.
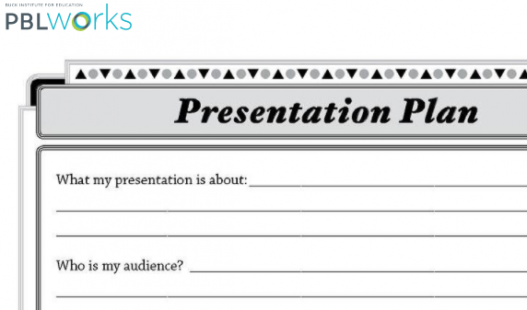
Student Handouts
This document helps students organize their presentations with a specific audience in mind.