
28 Results

Product Toolkit
An infographic is a visual representation of data, information, or ideas using graphics (images, illustrations, charts, diagrams) and minimal text. Infographics are often used to present large data sets or explain complex concepts in a way that is digestible and memorable.
Planning Tools
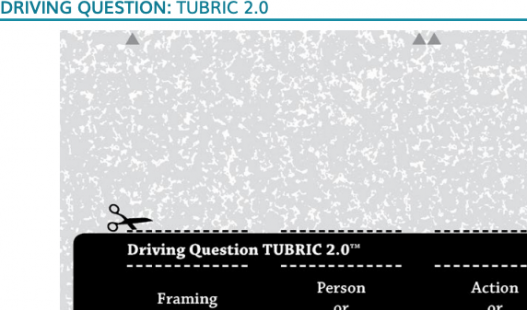
Frame the DQ's initial words, person or entity, action or challenge, and audience/purpose.
Planning Tools
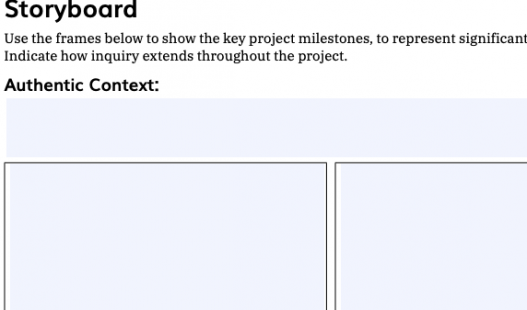
This planning document is designed to help you list the key project milestones, to represent significant moments or stages.
Planning Tools
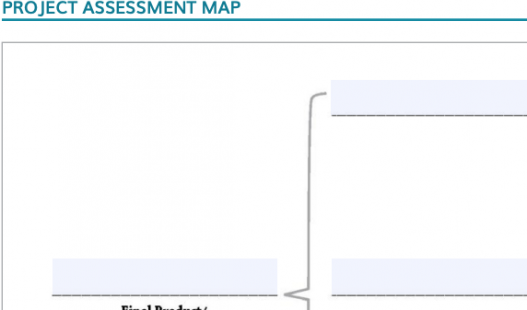
Plan how to use formative assessment in a project to be sure students are learning content and building 21st century competencies
Articles
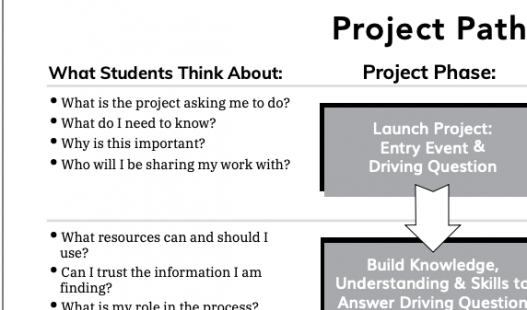
Overview of BIE's new model for teaching in a Project Based Learning environment.
Articles
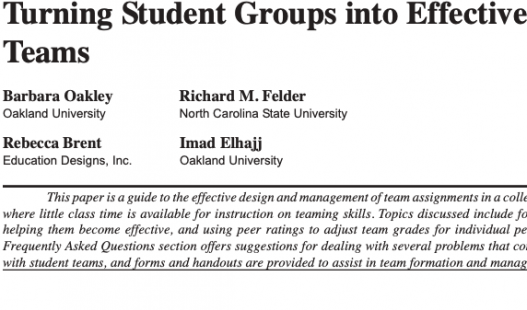
A guide to forming teams, helping them become effective, & using peer ratings to adjust grades.
Articles
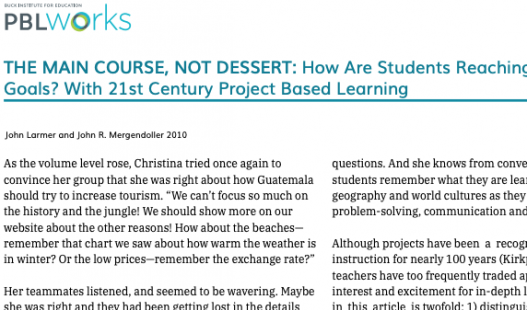
This article distinguishes between PBL and lightweight "projects" and argues why PBL is essential.